Showing posts with label market. Show all posts

Wednesday, November 17, 2010

Market Meets New Wall of Worry Or More Likely Just Brief Profit-Taking On Way To Higher Highs

NEW YORK - MARCH 08: Traders work on the newl...

Stocks pulled back after a big advance and that can be good for bull markets

Most of the bricks in the previous wall of worry have been removed.?Economic reports have continued to improve over recent weeks; in manufacturing, the service sector, retail sales, durable goods orders, and even in the employment picture, where 151,000 new jobs were created in October, more than double the 70,000 that economists expected.

The uncertainty over the Federal Reserve’s QE2 decision has been resolved with the Fed adding to the stimulating atmosphere, providing another round of quantitative easing in spite of the already improving economy.

The major U.S. market indexes, including the Dow, S&P 500, and Nasdaq rallied back to, and then above the potential resistance at their April peaks, before pulling back some this week.

Investors have become even more bullish and optimistic. This week’s poll of its members by the American Association of Individual Investors showed 57.6% bullish, the highest level in almost four years.

The good news apparently also reached Main Street. On Friday morning it was reported that the Thomson Reuters/University of Michigan’s Consumer Sentiment Index improved to 69.3 in early November (its highest level in five months) from 67.7 in October.

So what has been wrong with global markets this week?

Special Offer: Jim Oberweis bought Baidu at $7.90, earning readers huge profits.? Click here for more recommended stocks in the?Oberweis Report.

The U.S. market closed down roughly 2.5% for the week. Emerging markets, which many analysts projected would benefit the most from inflows of additional liquidity provided by the Fed’s decision, were down the most. Brazil, India, South Korea, closed down two to three percent for the week, while China closed down a big 5.5%. Meanwhile, Japan, a large developed country, which was not supposed to fare as well as emerging country markets, closed up 1.0% for the week.

A bet against emerging markets via the ProShares UltraShort Emerging Markets ETF, symbol EEV (designed to move up when emerging markets move down, and leveraged two to one) closed up almost 9.0% for the week.

Was it just that markets had become short-term overbought and ran into a brief bout of profit-taking, particularly since this was the week before the month’s options expirations week, and the week before tends to be negative?

If so, markets are likely to be back up next week since the decline this week took care of the short-term overbought condition, and next week is the week of the expirations, which tend to be positive.

Or was the decline the beginning of something more serious?

The market does seem to have a new wall of worry just a week after concerns about the economic recovery, and whether the Fed would or would not provide additional quantitative easing, faded away.

The bricks in the new wall of worry include:

  • Concerns that the Fed’s additional stimulus may cause new problems rather than help the economy by encouraging home purchases or providing new jobs.
  • Worries that commodity prices had spiked up into bubbles which may burst, a worry that struck Friday with the big $40 an ounce (3%) plunge in the price of gold, and equally large declines in the price of oil and other important commodities.
  • Apprehensions about the activities of the Chinese government, including talk that it might hike interest rates to dramatically slow its globally important economy and ward off threatening excessive inflation in China.
  • Anxiety about a potential currency or trade war if the decline in the U.S. dollar continues.

Via technical analysis there is also the U.S. market’s intermediate-term overbought condition above 20-week moving averages, and the high level of investor bullishness (which is at levels of complacency often seen at market tops).

The uncertainties have even extended to U.S. Treasury bonds, which investors have piled into as a perceived safe haven over the last two years. The safe haven over the last two months has actually been a bet against U.S. Treasury bonds. For instance, the ‘inverse’ ProShares Short 20-year bond etf, symbol TBF, designed to move up when bonds move down, has gained 11% since early September, while bonds have declined 11%.

There’s no doubt about it. We are still in a very fluid economic and investing period, not a time for investors to become so complacent as the investor sentiment readings seem to indicate, that they fall asleep at the switch.

(In the interest of full disclosure, we have positions in the U.S. market, the Japanese market, gold, and the ‘inverse’ bond ETF TBF, in our portfolio, at least at the moment).

This entry passed through the Full-Text RSS service — if this is your content and you're reading it on someone else's site, please read our FAQ page at fivefilters.org/content-only/faq.php
Five Filters featured article: Beyond Hiroshima - The Non-Reporting of Falluja's Cancer Catastrophe.

View the original article here

Market Meets New Wall of Worry Or More Likely Just Brief Profit-Taking On Way To Higher Highs

NEW YORK - MARCH 08: Traders work on the newl...

Stocks pulled back after a big advance and that can be good for bull markets

Most of the bricks in the previous wall of worry have been removed.?Economic reports have continued to improve over recent weeks; in manufacturing, the service sector, retail sales, durable goods orders, and even in the employment picture, where 151,000 new jobs were created in October, more than double the 70,000 that economists expected.

The uncertainty over the Federal Reserve’s QE2 decision has been resolved with the Fed adding to the stimulating atmosphere, providing another round of quantitative easing in spite of the already improving economy.

The major U.S. market indexes, including the Dow, S&P 500, and Nasdaq rallied back to, and then above the potential resistance at their April peaks, before pulling back some this week.

Investors have become even more bullish and optimistic. This week’s poll of its members by the American Association of Individual Investors showed 57.6% bullish, the highest level in almost four years.

The good news apparently also reached Main Street. On Friday morning it was reported that the Thomson Reuters/University of Michigan’s Consumer Sentiment Index improved to 69.3 in early November (its highest level in five months) from 67.7 in October.

So what has been wrong with global markets this week?

Special Offer: Jim Oberweis bought Baidu at $7.90, earning readers huge profits.? Click here for more recommended stocks in the?Oberweis Report.

The U.S. market closed down roughly 2.5% for the week. Emerging markets, which many analysts projected would benefit the most from inflows of additional liquidity provided by the Fed’s decision, were down the most. Brazil, India, South Korea, closed down two to three percent for the week, while China closed down a big 5.5%. Meanwhile, Japan, a large developed country, which was not supposed to fare as well as emerging country markets, closed up 1.0% for the week.

A bet against emerging markets via the ProShares UltraShort Emerging Markets ETF, symbol EEV (designed to move up when emerging markets move down, and leveraged two to one) closed up almost 9.0% for the week.

Was it just that markets had become short-term overbought and ran into a brief bout of profit-taking, particularly since this was the week before the month’s options expirations week, and the week before tends to be negative?

If so, markets are likely to be back up next week since the decline this week took care of the short-term overbought condition, and next week is the week of the expirations, which tend to be positive.

Or was the decline the beginning of something more serious?

The market does seem to have a new wall of worry just a week after concerns about the economic recovery, and whether the Fed would or would not provide additional quantitative easing, faded away.

The bricks in the new wall of worry include:

  • Concerns that the Fed’s additional stimulus may cause new problems rather than help the economy by encouraging home purchases or providing new jobs.
  • Worries that commodity prices had spiked up into bubbles which may burst, a worry that struck Friday with the big $40 an ounce (3%) plunge in the price of gold, and equally large declines in the price of oil and other important commodities.
  • Apprehensions about the activities of the Chinese government, including talk that it might hike interest rates to dramatically slow its globally important economy and ward off threatening excessive inflation in China.
  • Anxiety about a potential currency or trade war if the decline in the U.S. dollar continues.

Via technical analysis there is also the U.S. market’s intermediate-term overbought condition above 20-week moving averages, and the high level of investor bullishness (which is at levels of complacency often seen at market tops).

The uncertainties have even extended to U.S. Treasury bonds, which investors have piled into as a perceived safe haven over the last two years. The safe haven over the last two months has actually been a bet against U.S. Treasury bonds. For instance, the ‘inverse’ ProShares Short 20-year bond etf, symbol TBF, designed to move up when bonds move down, has gained 11% since early September, while bonds have declined 11%.

There’s no doubt about it. We are still in a very fluid economic and investing period, not a time for investors to become so complacent as the investor sentiment readings seem to indicate, that they fall asleep at the switch.

(In the interest of full disclosure, we have positions in the U.S. market, the Japanese market, gold, and the ‘inverse’ bond ETF TBF, in our portfolio, at least at the moment).

This entry passed through the Full-Text RSS service — if this is your content and you're reading it on someone else's site, please read our FAQ page at fivefilters.org/content-only/faq.php
Five Filters featured article: Beyond Hiroshima - The Non-Reporting of Falluja's Cancer Catastrophe.

View the original article here

Saturday, October 30, 2010

Guest post: is there a bubble on the bond market?

Translate Request has too much data
Parameter name: request
Error in deserializing body of reply message for operation 'Translate'. The maximum string content length quota (8192) has been exceeded while reading XML data. This quota may be increased by changing the MaxStringContentLength property on the XmlDictionaryReaderQuotas object used when creating the XML reader. Line 1, position 9002.

By John Y Campbell, Adi Sunderam, and Luis M Viceira, first posted at VoxEU

The historically low yields on Treasury bonds are the hallmark of a bubble, according to some commentators. This column analyses the relationship between bond yields, the stock market, and inflation over the past 50 years. It finds that the riskiness of nominal bonds changes over time and that investors and policymakers can use the changing stock-bond correlation as a real-time measure of inflation expectations.

The yields on government bonds are at their lowest levels since the depths of the financial crisis in late 2008. On Monday 18 October, the yield on 10-year Treasury notes hit 2.52%, down from 3.85% at the beginning of the year. This movement is huge by the standards of the Treasury market. An investment in 10-year Treasury notes has returned about 11.4% this year.

Moreover, nominal bonds are exposed to inflation risk. Given that the use of unconventional monetary policy has increased uncertainty about inflation (e.g. Taylor 2009), one might expect investors to regard bonds as particularly risky and demand high yields (low prices). The persistence of historically low yields in the face of such risks has led some commentators, notably Siegel and Schwarz (2010), to suggest there is a bubble in the government bond market.

Bond valuation and risk

What determines how much investors are willing to pay for nominal bonds? There are three critical factors:

* expected inflation,
* real interest rates, and
* risk premia.

Since inflation erodes the real value of the payments bond investors receive, they must adjust prices for expected inflation to earn their target real interest rate. In addition, bonds are risky because realised inflation and interest rates can turn out to be different than investors’ expectations. Risk premia are compensation for bearing this risk.

In recent work, we examine how the riskiness of bonds varies over time (Viceira 2010; Campbell et al. 2009). In particular, we argue that inflation makes bonds risky at certain times, while giving them insurance, or hedge, value at others. For instance, if inflation rises unexpectedly when economic conditions deteriorate, the real value of bond payments falls unexpectedly. In this case, bond investors sustain losses when they likely need funds, and bonds are risky assets that investors should charge a risk premium for holding.

In contrast, if inflation falls unexpectedly when economic conditions deteriorate, bonds are like insurance, providing a windfall at the time investors need it the most. Bond investors should be willing to pay for this insurance value, just as they are willing to pay for other types of insurance. In this case, the inflation risk premium should actually be negative.
Historical evidence

The idea that the riskiness of nominal bonds changes over time is consistent with the evolution of conventional wisdom among investors. In the late 1970s and early 1980s, investors regarded bonds as risky. The famous bear Henry Kaufman, also known as “Dr. Doom”, argued that investors should completely avoid bonds unless they offered high risk premia. In contrast, by the early 2000s investors had come to regard bonds as a safe haven against the risk of a Japan-style episode of deflation.

This conventional wisdom is broadly consistent with the lessons of financial economics. In particular, the Capital Asset Pricing Model (CAPM) uses the stock market as a proxy for economic conditions. This suggests a simple metric for the riskiness of an asset: how its returns co-move with stock market returns. Risky assets do poorly at the same time the stock market does poorly, causing investors to sustain losses at the worst possible moment. Such assets should have large risk premia to compensate investors for this risk. In contrast, safe assets do well when the stock market does poorly, adding insurance or hedge value to investor portfolios. These assets require small or even negative risk premia.

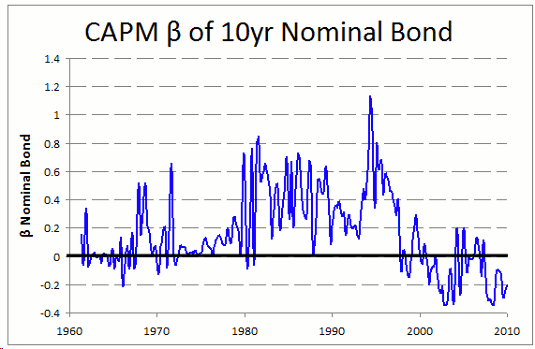
Figure 1. Stock and bond returns over time

ViciFig1(1)

Figure 1 plots the co-movement of stock and bond returns over time. The intuitions of the CAPM are broadly consistent with the way investors have historically viewed bonds. In the late 1970s and 1980s, stock and bond returns co-moved positively. When stocks did poorly bonds also did poorly, consistent with the idea that they were risky. By the 2000s, stock and bond returns co-moved negatively, suggesting that bonds had become safe havens.

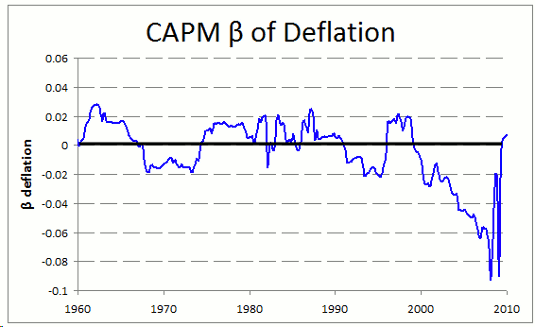
Figure 2. Bond returns and inflation over time

ViciFig2

Figure 2 shows that the behaviour of bond returns is related to the behaviour of inflation by plotting the historical co-movement of stock returns and inflation. Since inflation is bad for bond returns we invert the graph. The pattern is very similar to the co-movement of bond returns and stock returns: positive in the 1970s and 1980s and negative in the 2000s.

Thus, it appears that the changing risks of nominal bonds are related to the changing relationship between inflation and economic growth. When inflation is procyclical, as it was in the 1960s and 2000s, inflation falls at the same time that unemployment is rising and growth is falling. During these periods, stocks and nominal bonds are negatively correlated and nominal bonds hedge deflation risk. In contrast, when inflation is countercyclical, as it was in the 1970s and 1980s, inflation rises as unemployment rises and growth falls. In an environment of stagflation, stocks and nominal bonds are positively correlated and nominal bonds are risky.

Implications for the current environment

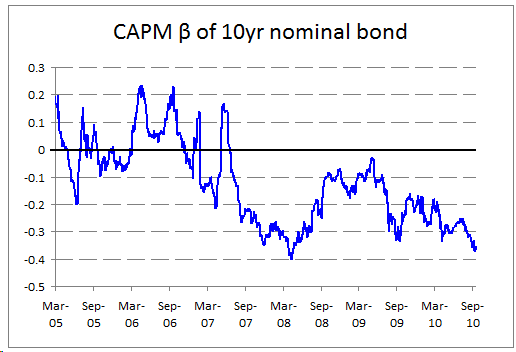
What can this model for bond prices tell us about the world today? Figure 3 shows the co-movement of stock and bond returns, our measure of riskiness, over the last five years. The series turned sharply negative once the financial crisis began in mid-2007, briefly returned towards zero by mid-2009, and has again been quite negative over the past year.

Figure 3. Stock and bond returns and riskiness over time

ViciFig3(1)

The stock-bond correlation implies that investors currently view government bonds as a hedge against the possibility of deflation and low growth. Though they may be uncertain about the direction of inflation over the next five years, investors appear to believe that any increase in inflation will likely be accompanied by growth, making it less painful for their portfolios.

In evaluating the current level of bond prices, the critical question is whether investors are correct. If inflation will indeed be accompanied by growth, then nominal bonds should carry a negative inflation risk premium and correspondingly high prices. However, it is also possible that the economy could enter a period of stagflation with high inflation and low growth. In this case, investors should be charging a higher inflation risk premium, and bond prices should be lower today.

Our work also has important implications for policymakers trying to use financial data to understand inflation expectations. First, policymakers can use the stock-bond correlation as a “canary in the coalmine.” If the correlation starts to turn positive, policymakers will know that investor anxiety about stagflation is rising. They can then take steps to keep inflation expectations well-anchored.

Second, policymakers often use break-even inflation, the difference between the yields on nominal and inflation-indexed bonds (TIPS), as a proxy for market inflation expectations. However, this quantity is actually the sum of expected inflation and the inflation risk premium. Thus, if the inflation risk premium is negative, breakeven inflation understates market inflation expectations. The negative correlation between stocks and bonds today suggests that the inflation risk premium on Treasuries is negative, and it could be as low as -75 or -85 basis points. This implies that investor expectations of 10-year inflation reflected in the bond market are around 2.7%, in line with the view of professional forecasters and the inflation swap market.

Conclusions

Financial market data suggest that investors expect inflation to be moderate and procyclical going forward. However, the behaviour of inflation has changed in the past and may do so again. Investors and policymakers alike can use the stock-bond correlation as a real-time measure of inflation expectations.

This entry passed through the Full-Text RSS service — if this is your content and you're reading it on someone else's site, please read our FAQ page at fivefilters.org/content-only/faq.php
Five Filters featured article: Beyond Hiroshima - The Non-Reporting of Falluja's Cancer Catastrophe.


View the original article here